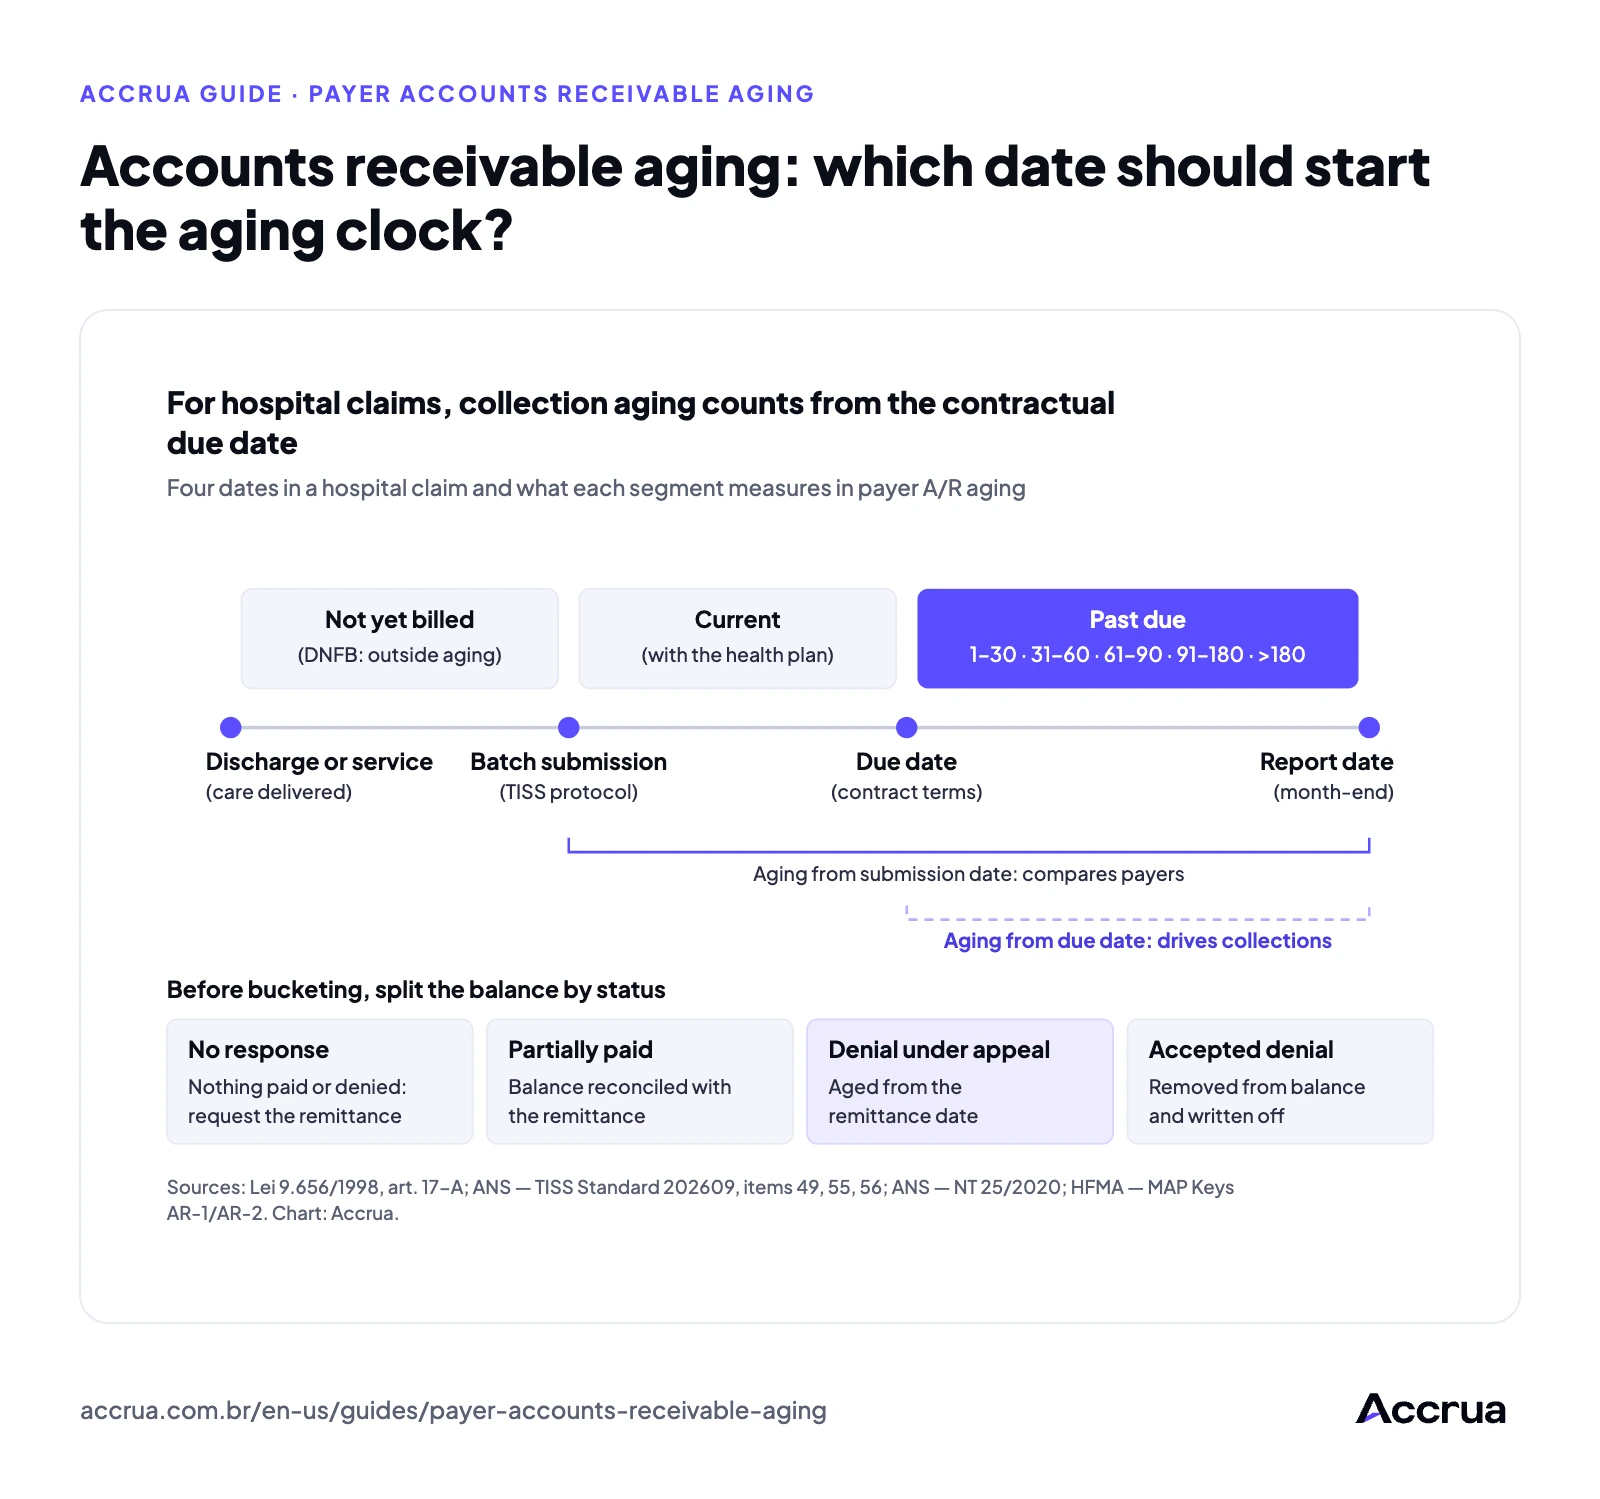
Payer accounts receivable aging Accounts receivable aging: which date should start the aging clock?
Sources: Lei 9.656/1998 (Law 9,656/1998), art. 17-A; ANS — TISS Standard, Organizational Component 202609, items 49, 55 and 56; ANS — Technical Note 25/2020/GASNT; HFMA — MAP Keys AR-1 and AR-2. Chart: Accrua. Produced by Accrua.
See in the guide: Hospital accounts receivable aging: how to build and analyze it by payerPayer receivables financing Payer receivables financing: how denials change the risk for the hospital
Illustrative Accrua diagram: steps in financing a health plan invoice. The rules depend on the financing agreement and the payer contract. Produced by Accrua.
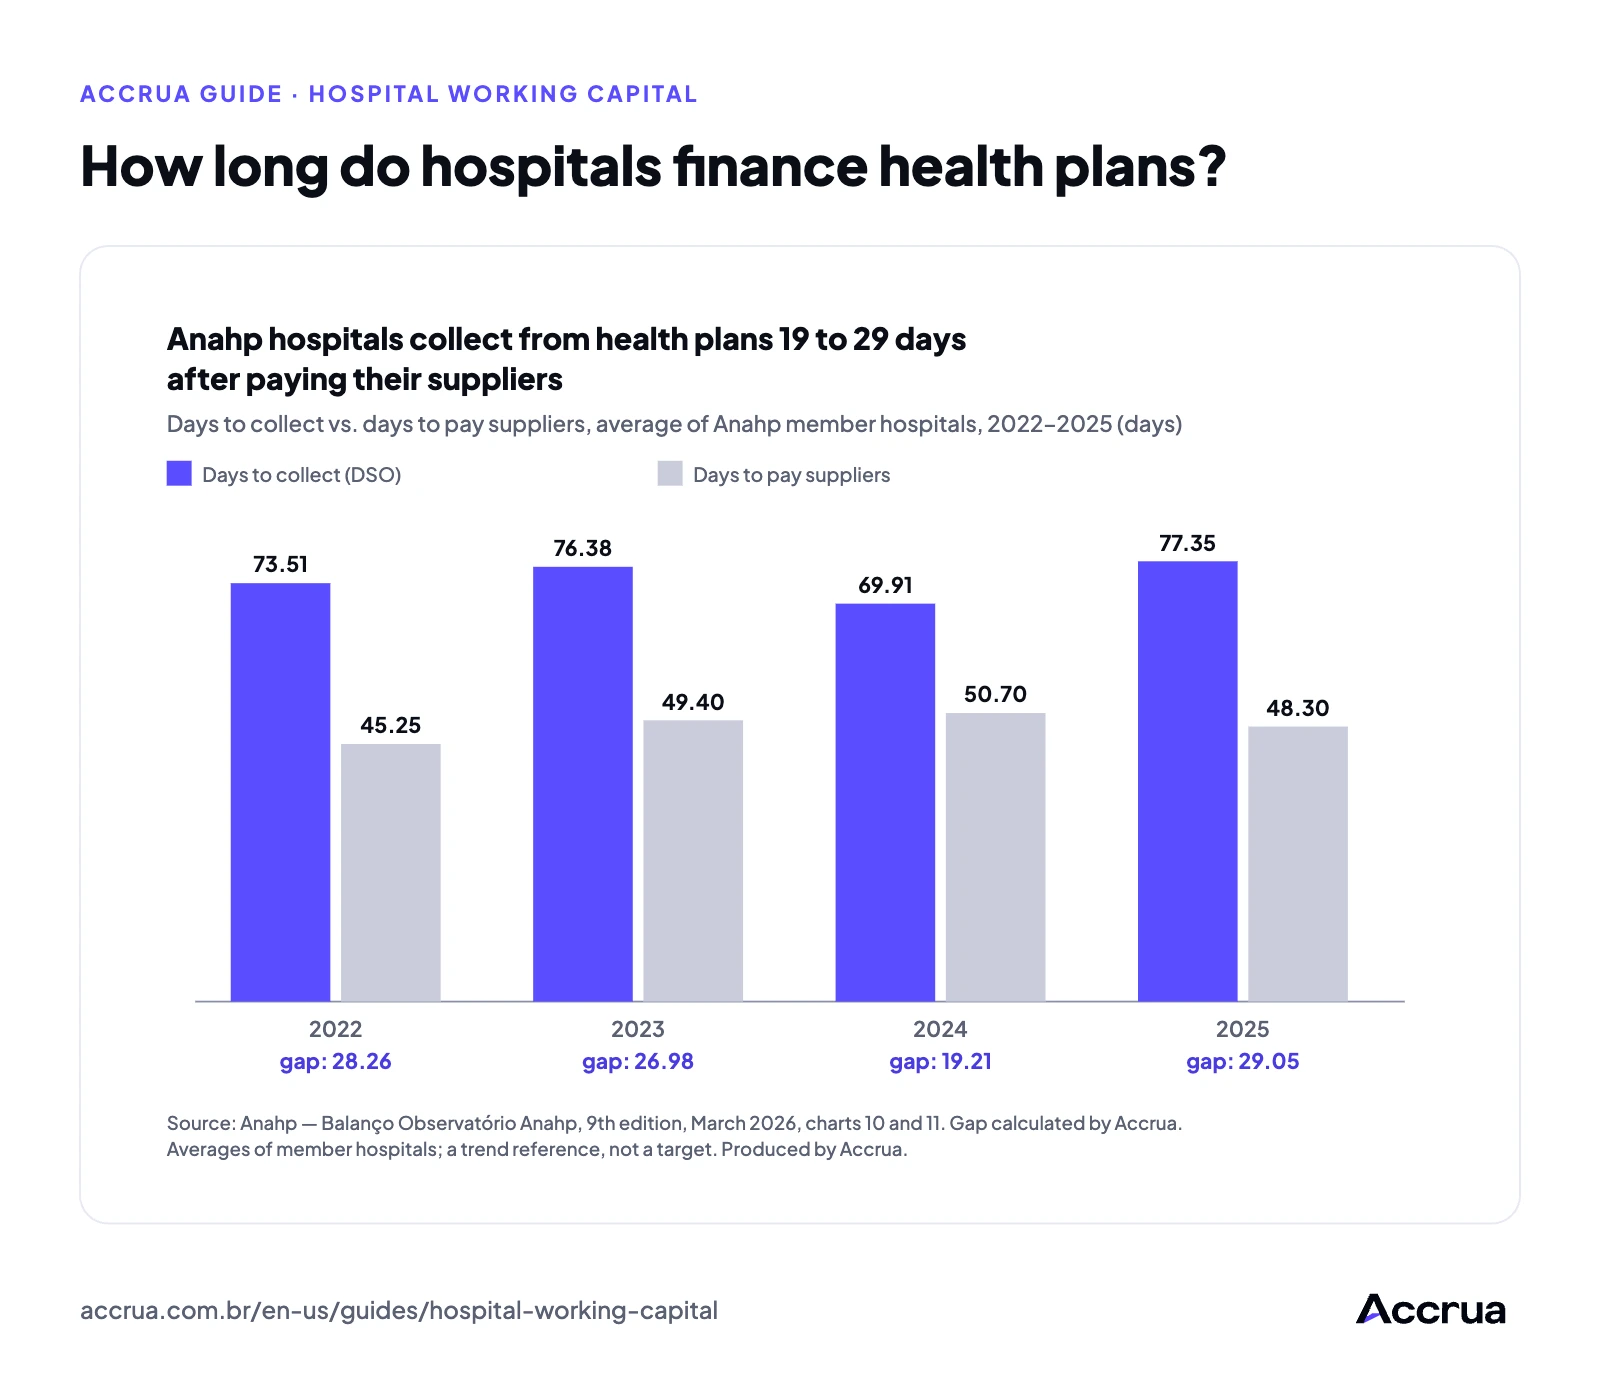
See in the guide: Payer receivables financing: when it pays offHospital working capital How long do hospitals finance health plans?
Source: Anahp — Balanço Observatório Anahp, 9th edition, March 2026, charts 10 and 11 · average payment terms of Anahp hospitals, 2022–2025. Gap calculated by Accrua. Produced by Accrua.
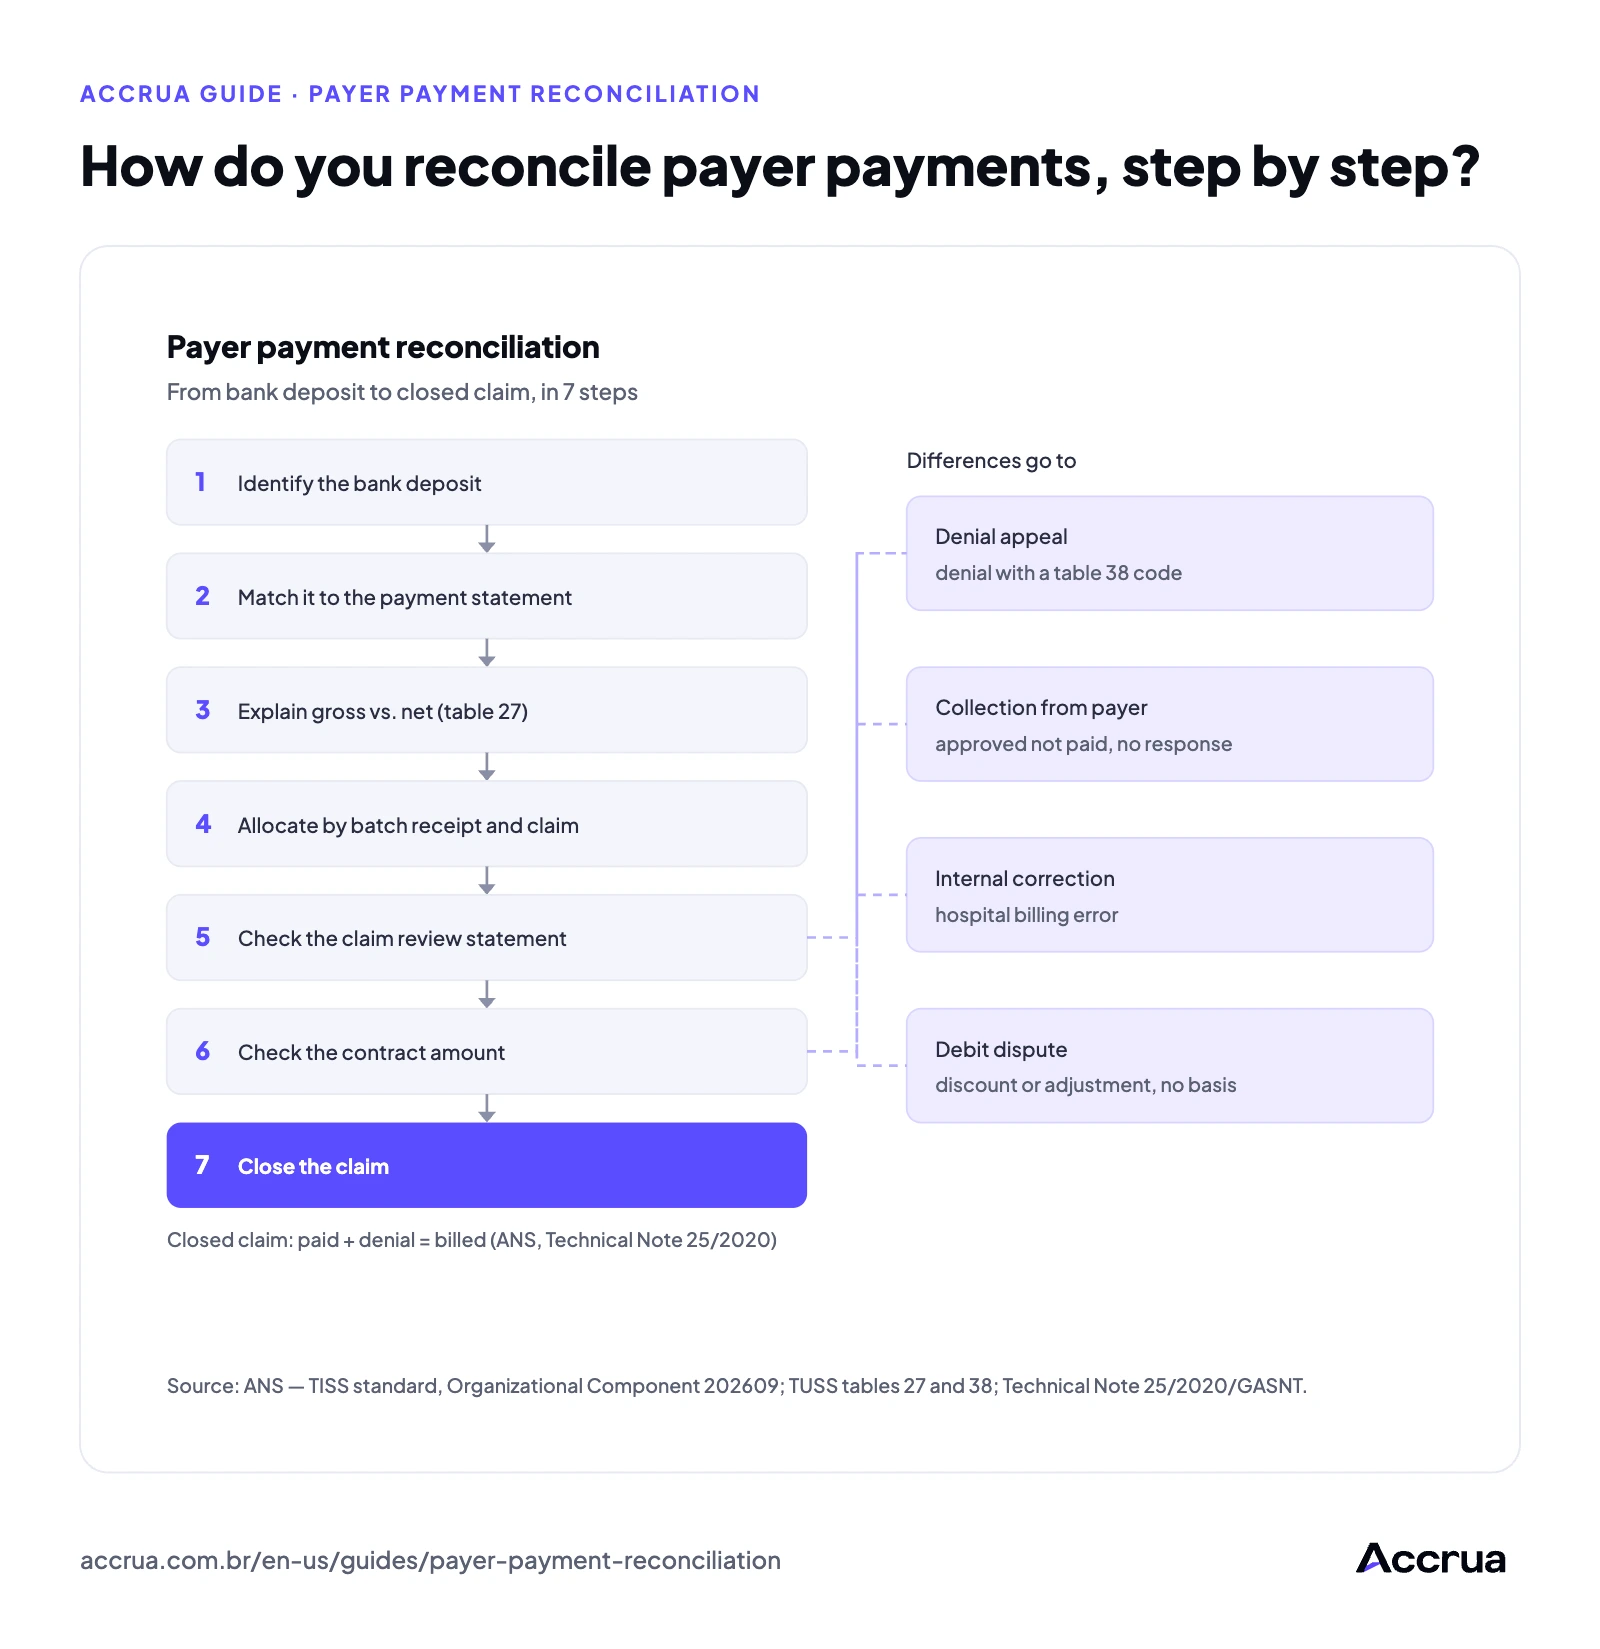
See in the guide: Hospital working capital: how to fund operations with long collection periodsPayer payment reconciliation How do you reconcile payer payments, step by step?
Source: ANS — TISS standard, Organizational Component 202609; TUSS tables 27 and 38; Technical Note 25/2020/GASNT (closed-claim criterion). The queues for differences are an editorial proposal. Produced by Accrua.
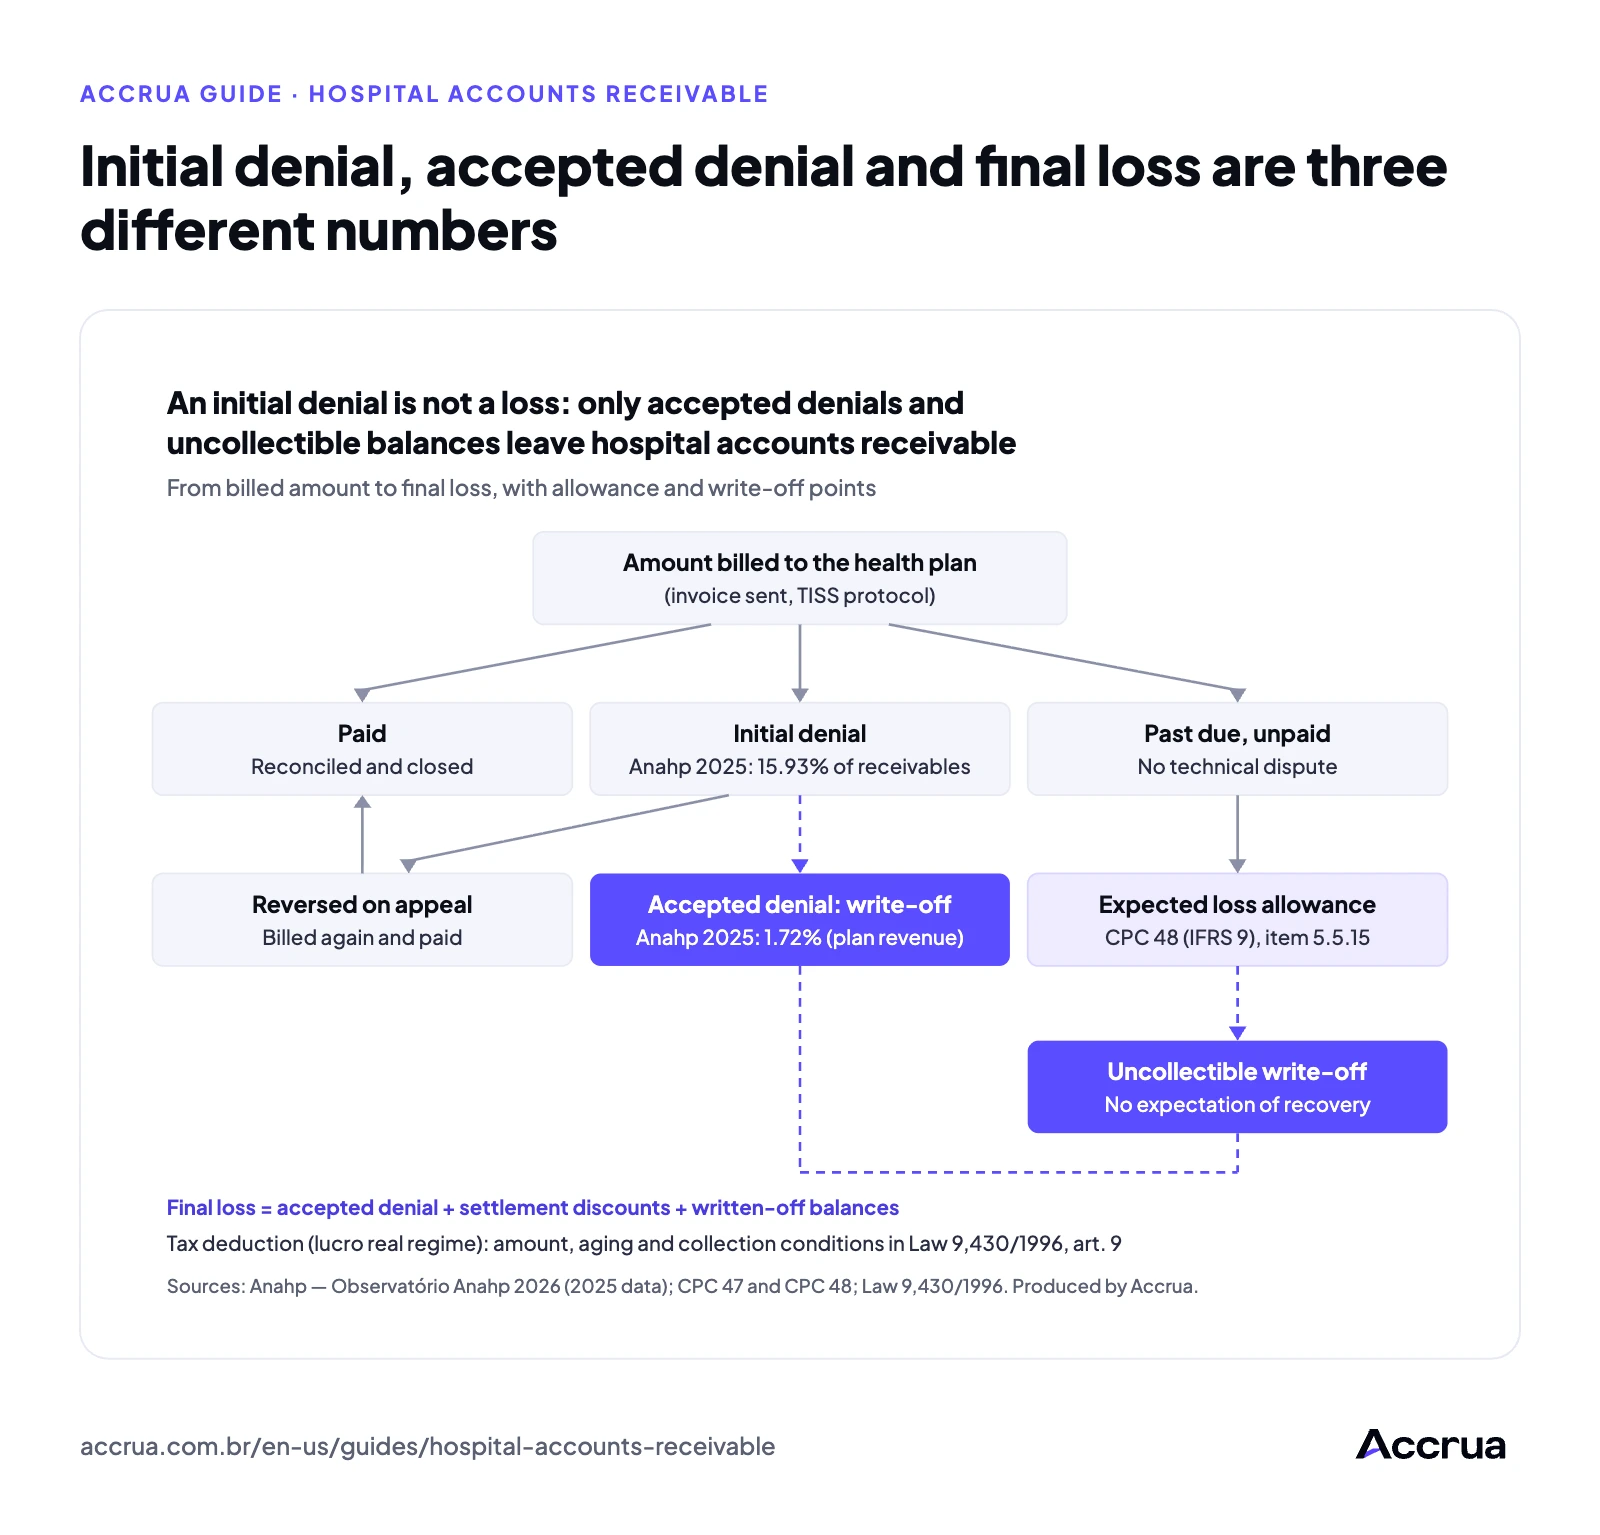
See in the guide: Payer payment reconciliation: step by step from bank deposit to closed claimHospital accounts receivable Initial denial, accepted denial and final loss are three different numbers
Sources: Anahp — Observatório Anahp 2026 (2025 data): initial denial of 15.93% of amounts receivable from health plans and accepted denial of 1.72% of gross health plan revenue; CPC 48 (IFRS 9), items 5.4.4 and 5.5.15; CPC 47 (IFRS 15), items 50 to 56; Law 9,430/1996, art. 9. Produced by Accrua.
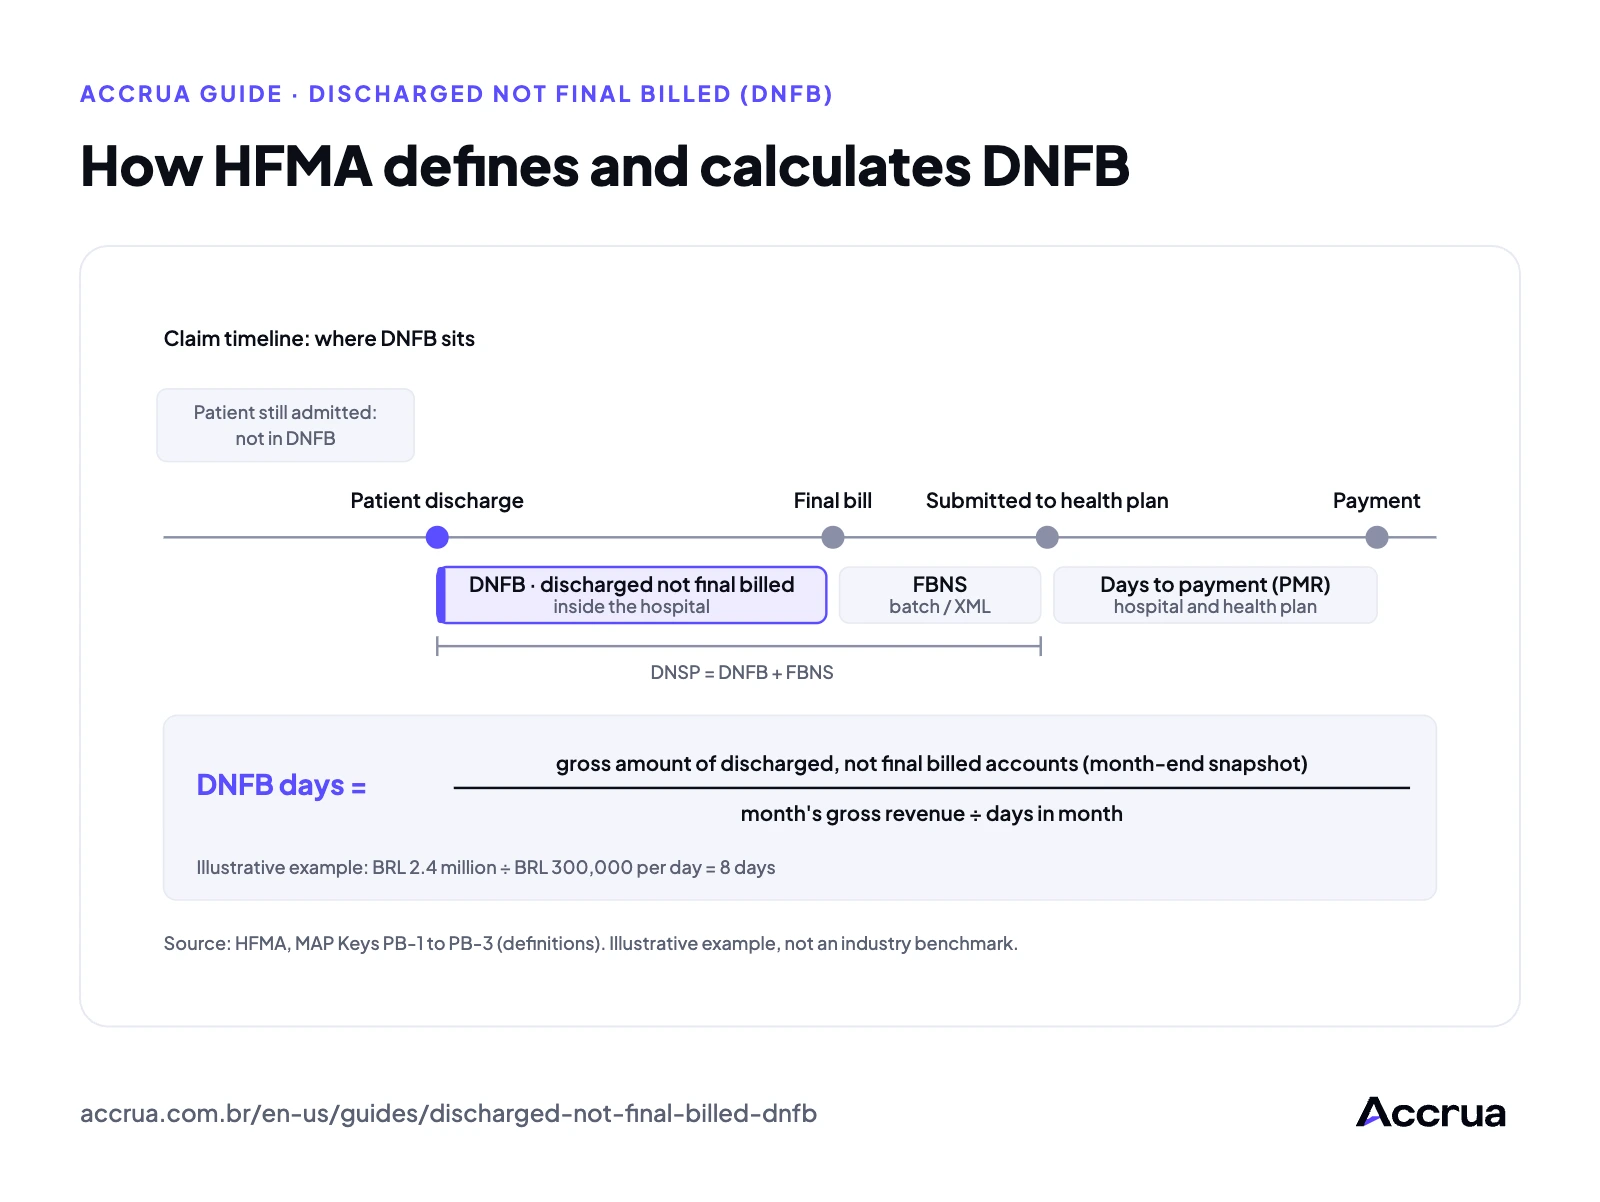
See in the guide: Hospital accounts receivable: allowances, write-offs and lossesDischarged not final billed (DNFB) How HFMA defines and calculates DNFB
Claim timeline from discharge to payment: DNFB is the stretch between discharge and final bill. Source: HFMA, MAP Keys PB-1 to PB-3. Illustrative numbers. Produced by Accrua.
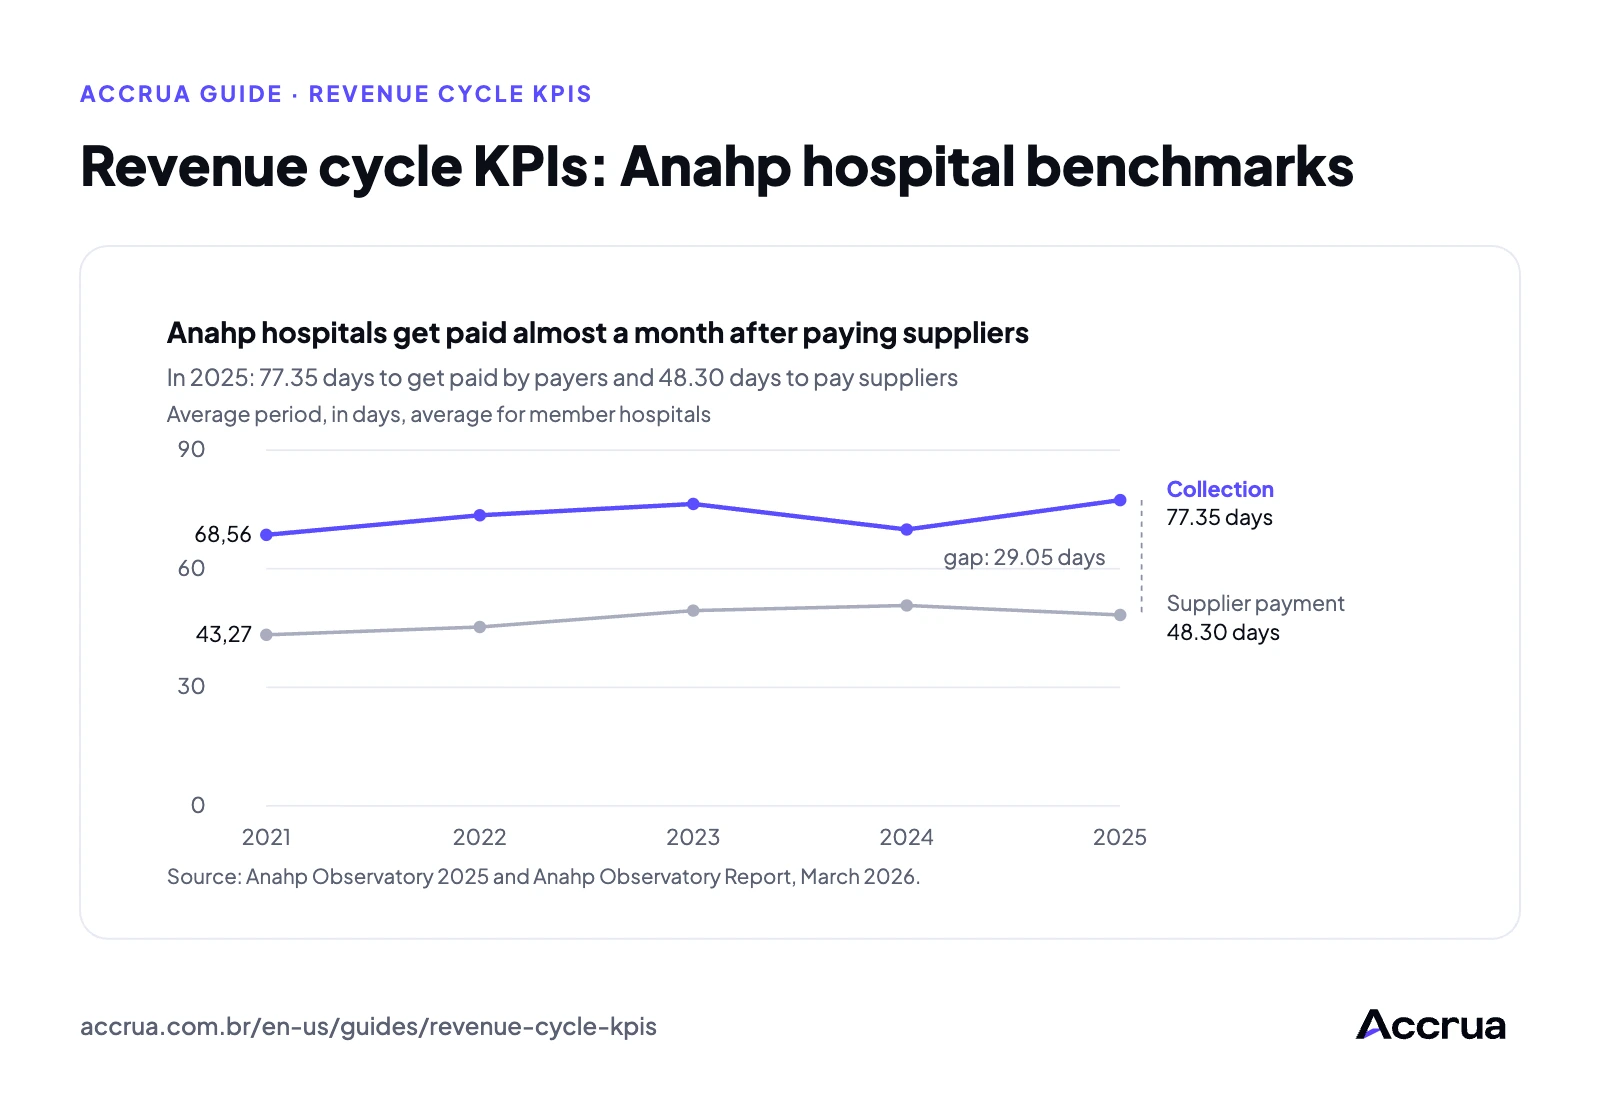
See in the guide: Discharged not final billed (DNFB): the forgotten KPI and how to reduce itRevenue cycle KPIs Revenue cycle KPIs: Anahp hospital benchmarks
Source: Anahp Observatory 2025 and Anahp Observatory Report, March 2026 · average periods for Anahp hospitals, 2021–2025. Produced by Accrua.
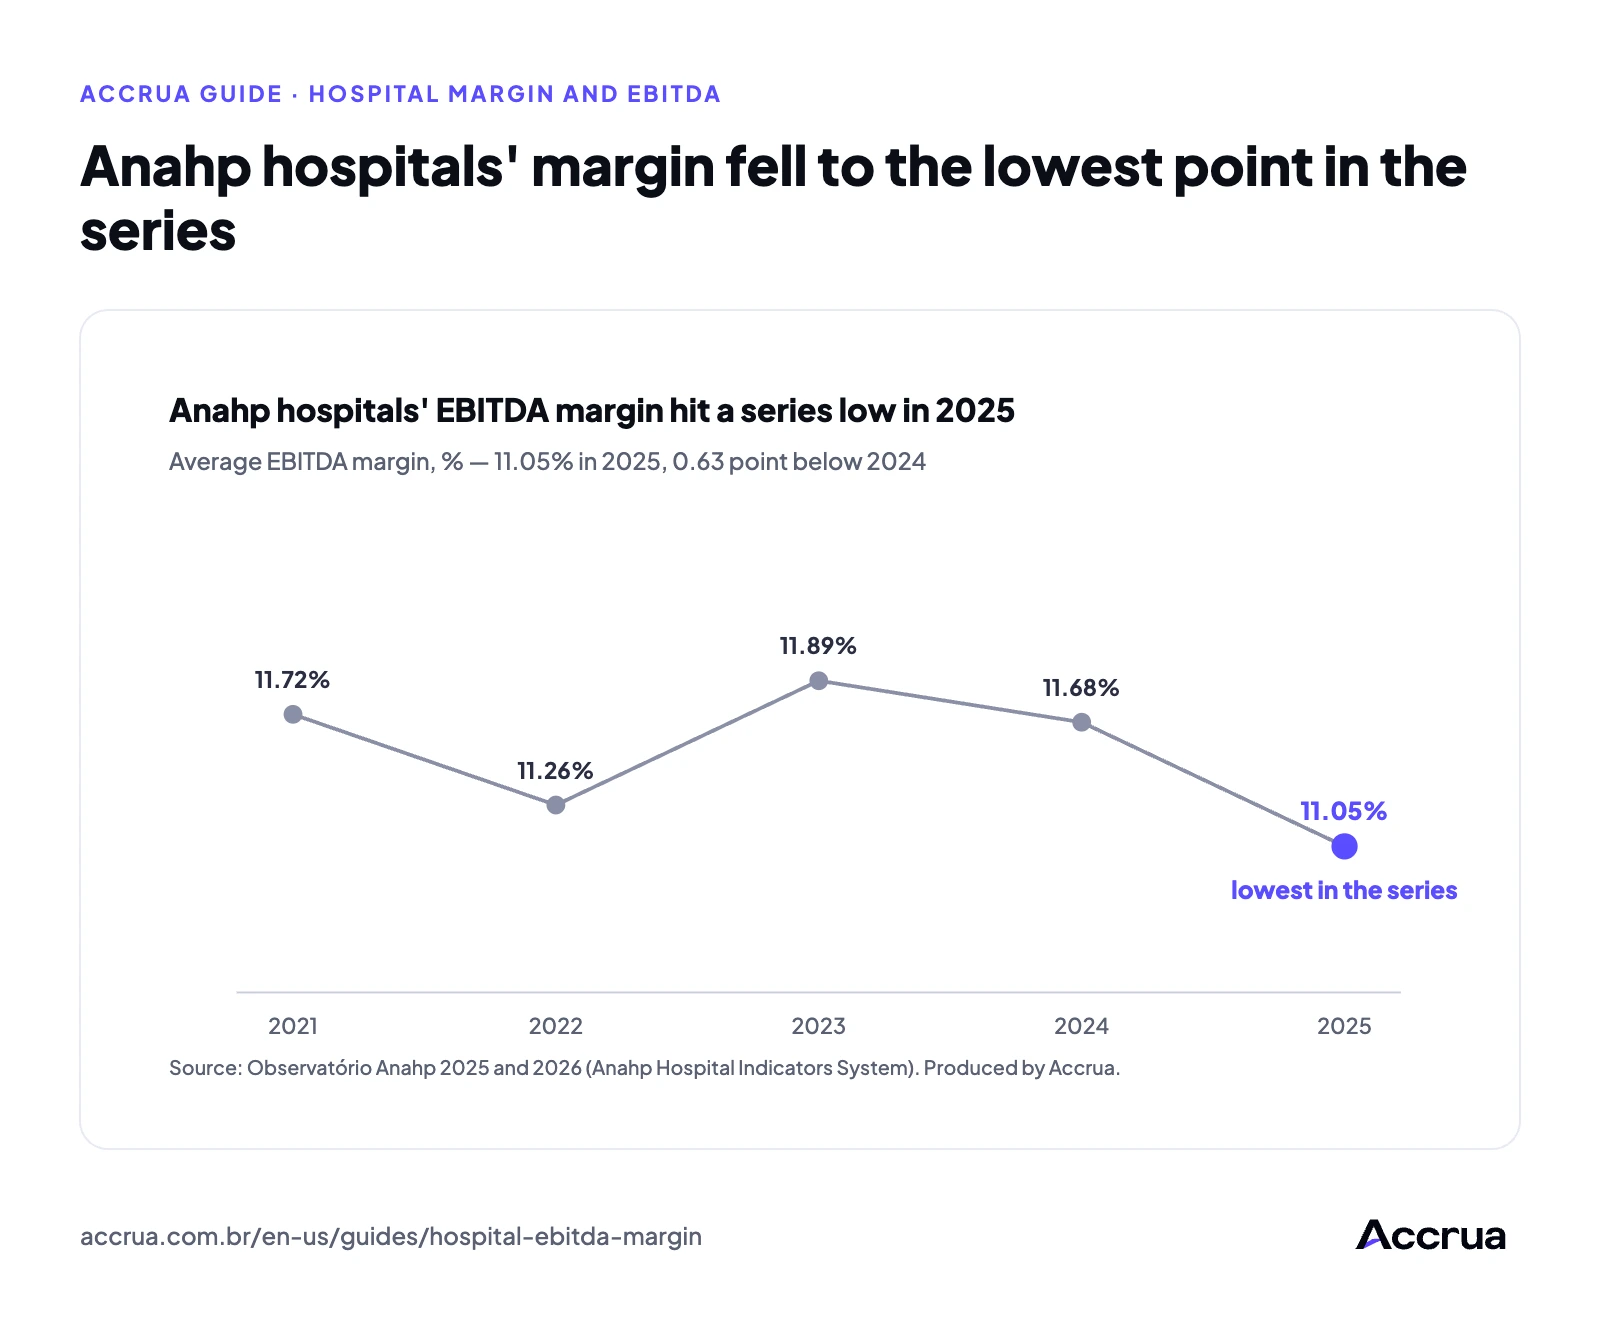
See in the guide: Revenue cycle KPIs: 20 metrics with formulas and industry benchmarksHospital margin and EBITDA Anahp hospitals' margin fell to the lowest point in the series
Average EBITDA margin of hospitals that belong to Anahp, 2021–2025. Source: Observatório Anahp 2025 (Chart 5, p. 146) and Observatório Anahp 2026 (Chart 5, p. 198), Anahp Hospital Indicators System. Produced by Accrua.
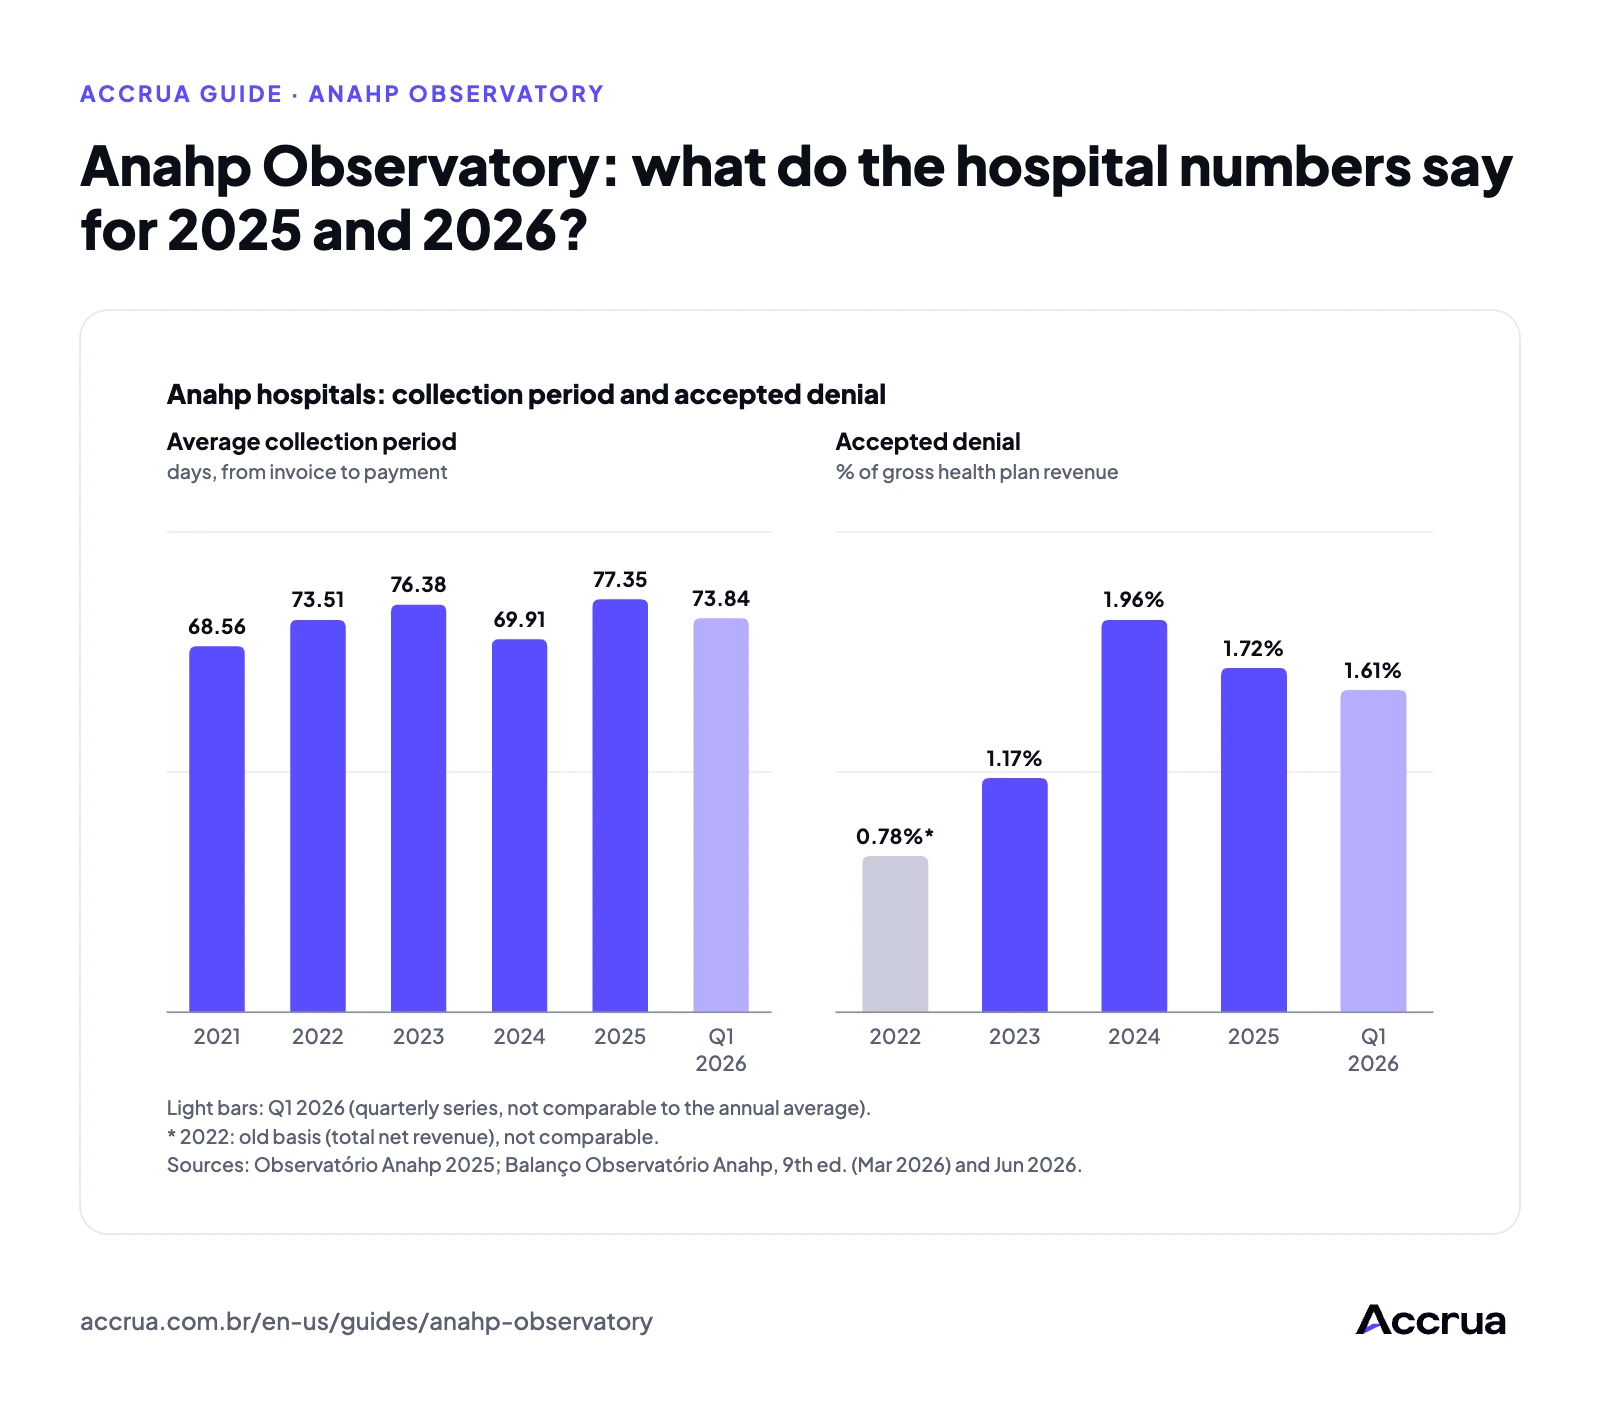
See in the guide: Hospital margin and EBITDA: how much the revenue cycle weighs on resultsAnahp Observatory Anahp Observatory: what do the hospital numbers say for 2025 and 2026?
Source: Observatório Anahp 2025 and Balanço Observatório Anahp (9th edition, March 2026, and June 2026) · average of member hospitals. Annual and Q1 values are different series. Produced by Accrua.
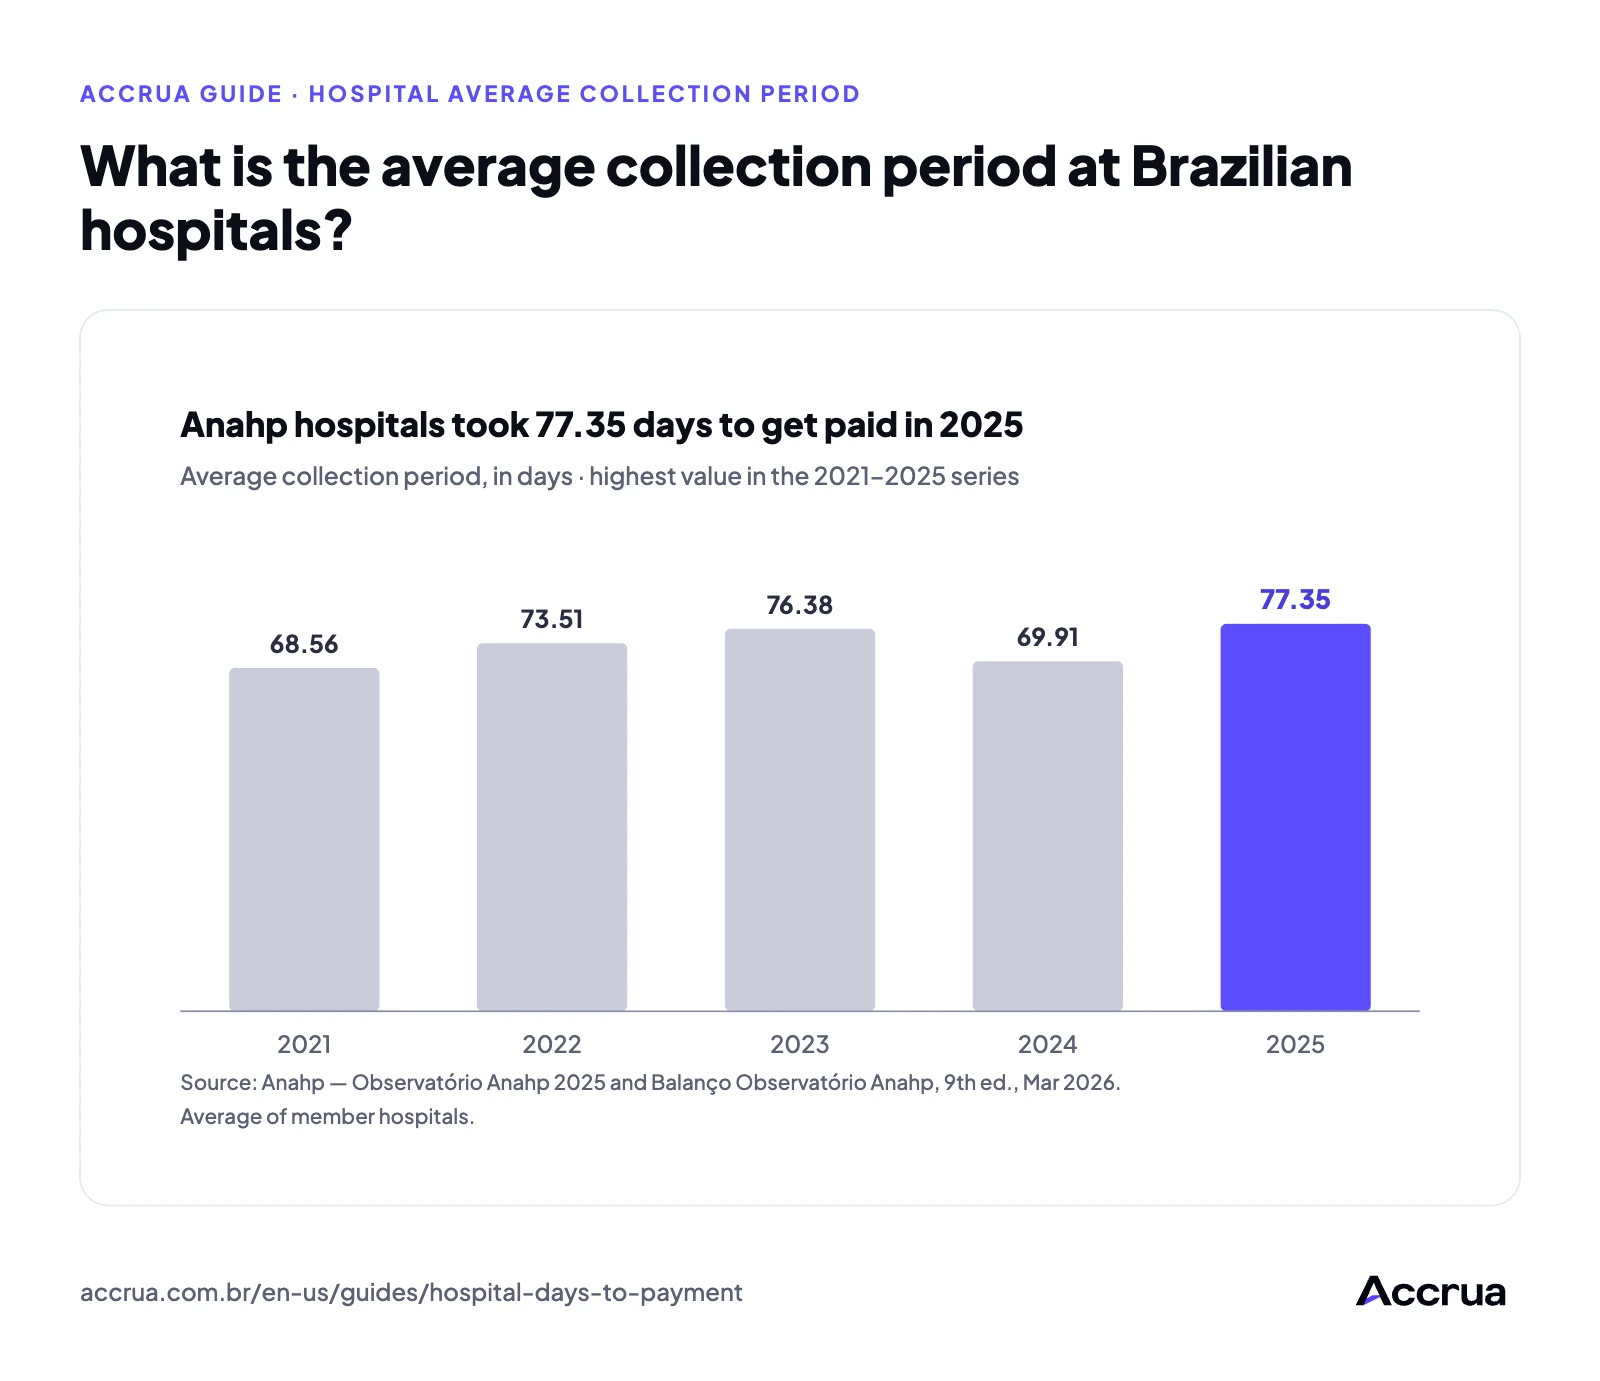
See in the guide: Anahp Observatory: what the numbers say in each editionHospital average collection period What is the average collection period at Brazilian hospitals?
Source: Anahp — Observatório Anahp 2025 (2021–2024 data) and Balanço Observatório Anahp, 9th edition, March 2026 (2025 data). Average collection period, average of member hospitals, in days. Produced by Accrua.
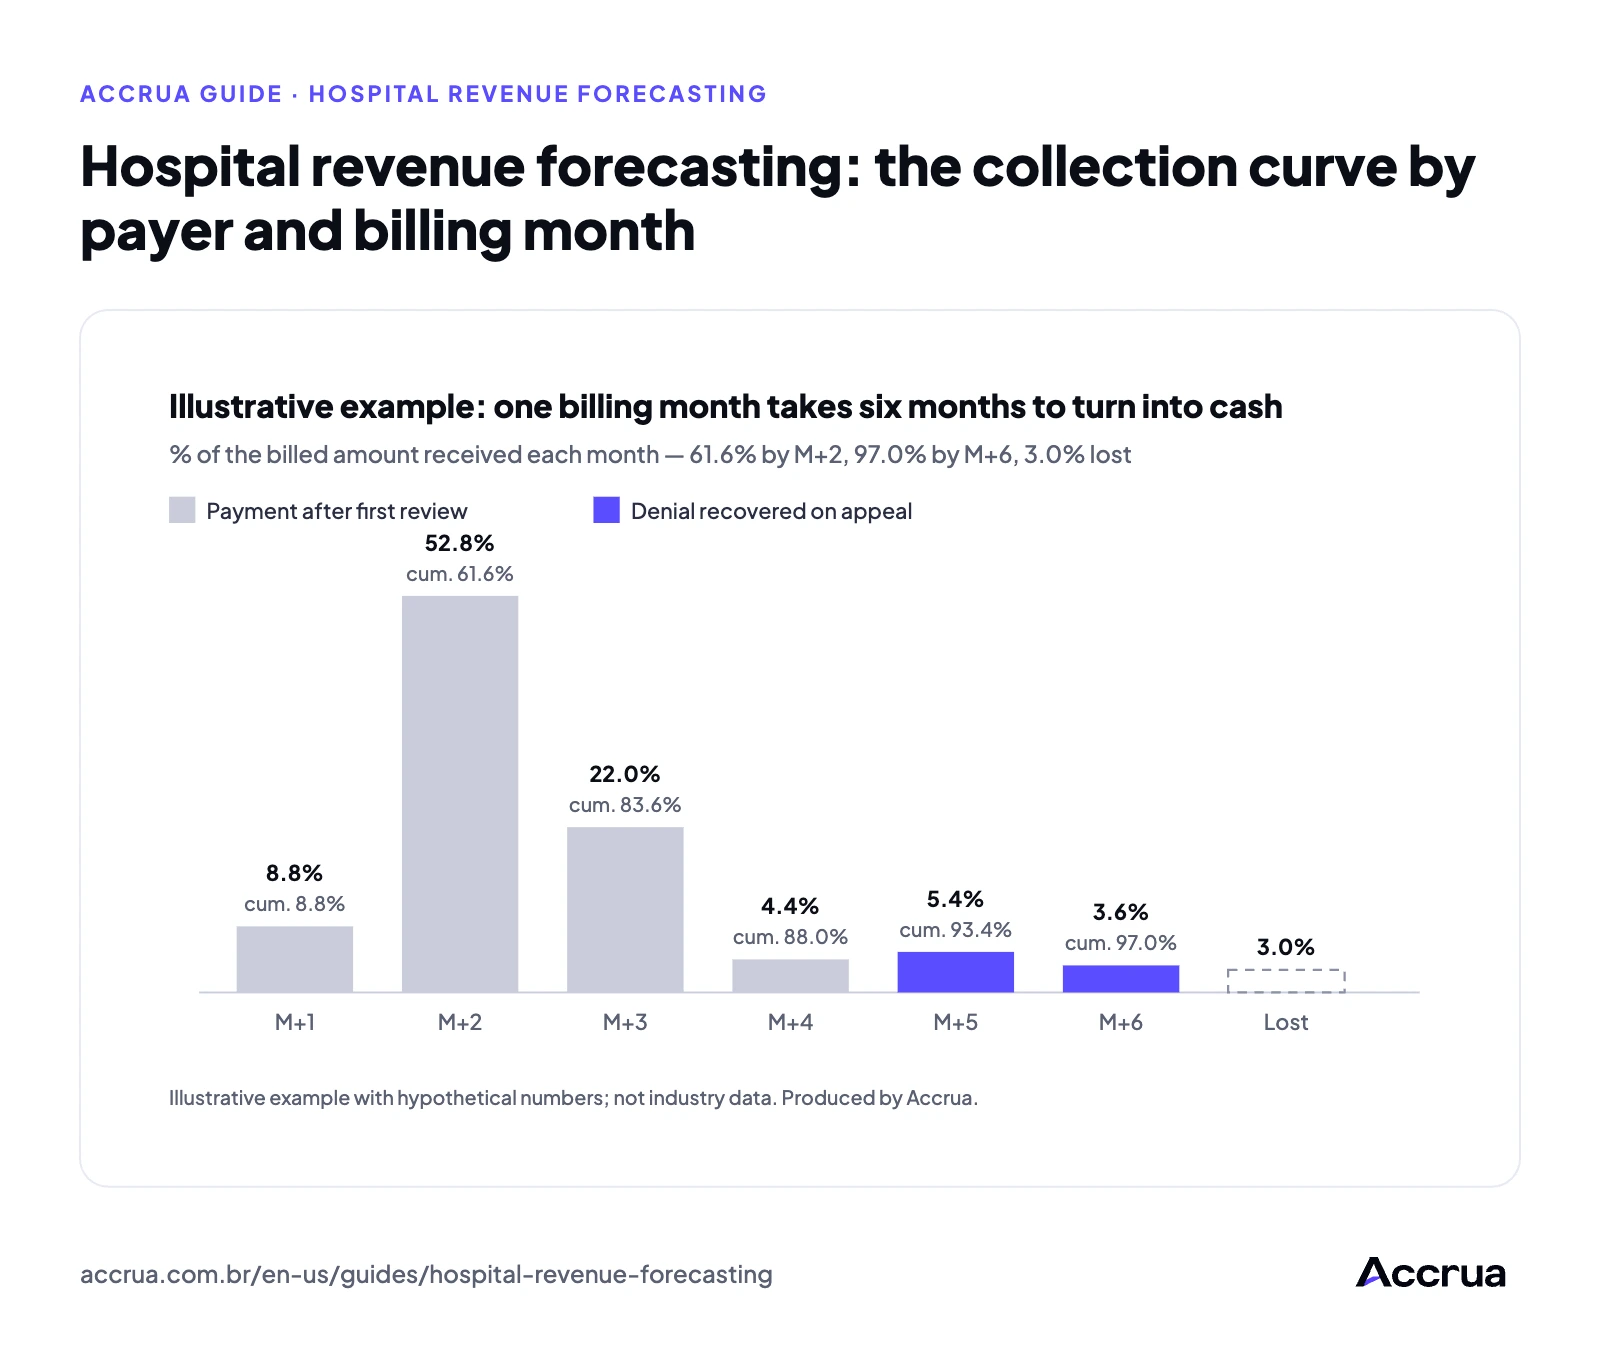
See in the guide: Days in A/R for hospitals: how to calculate and reduce the average collection periodHospital revenue forecasting Hospital revenue forecasting: the collection curve by payer and billing month
Illustrative example with hypothetical numbers: collection curve of one billing month of BRL 1,000,000 submitted to a health plan, with a 12% initial denial rate and 75% of denials recovered on appeal. Not industry data. Produced by Accrua.
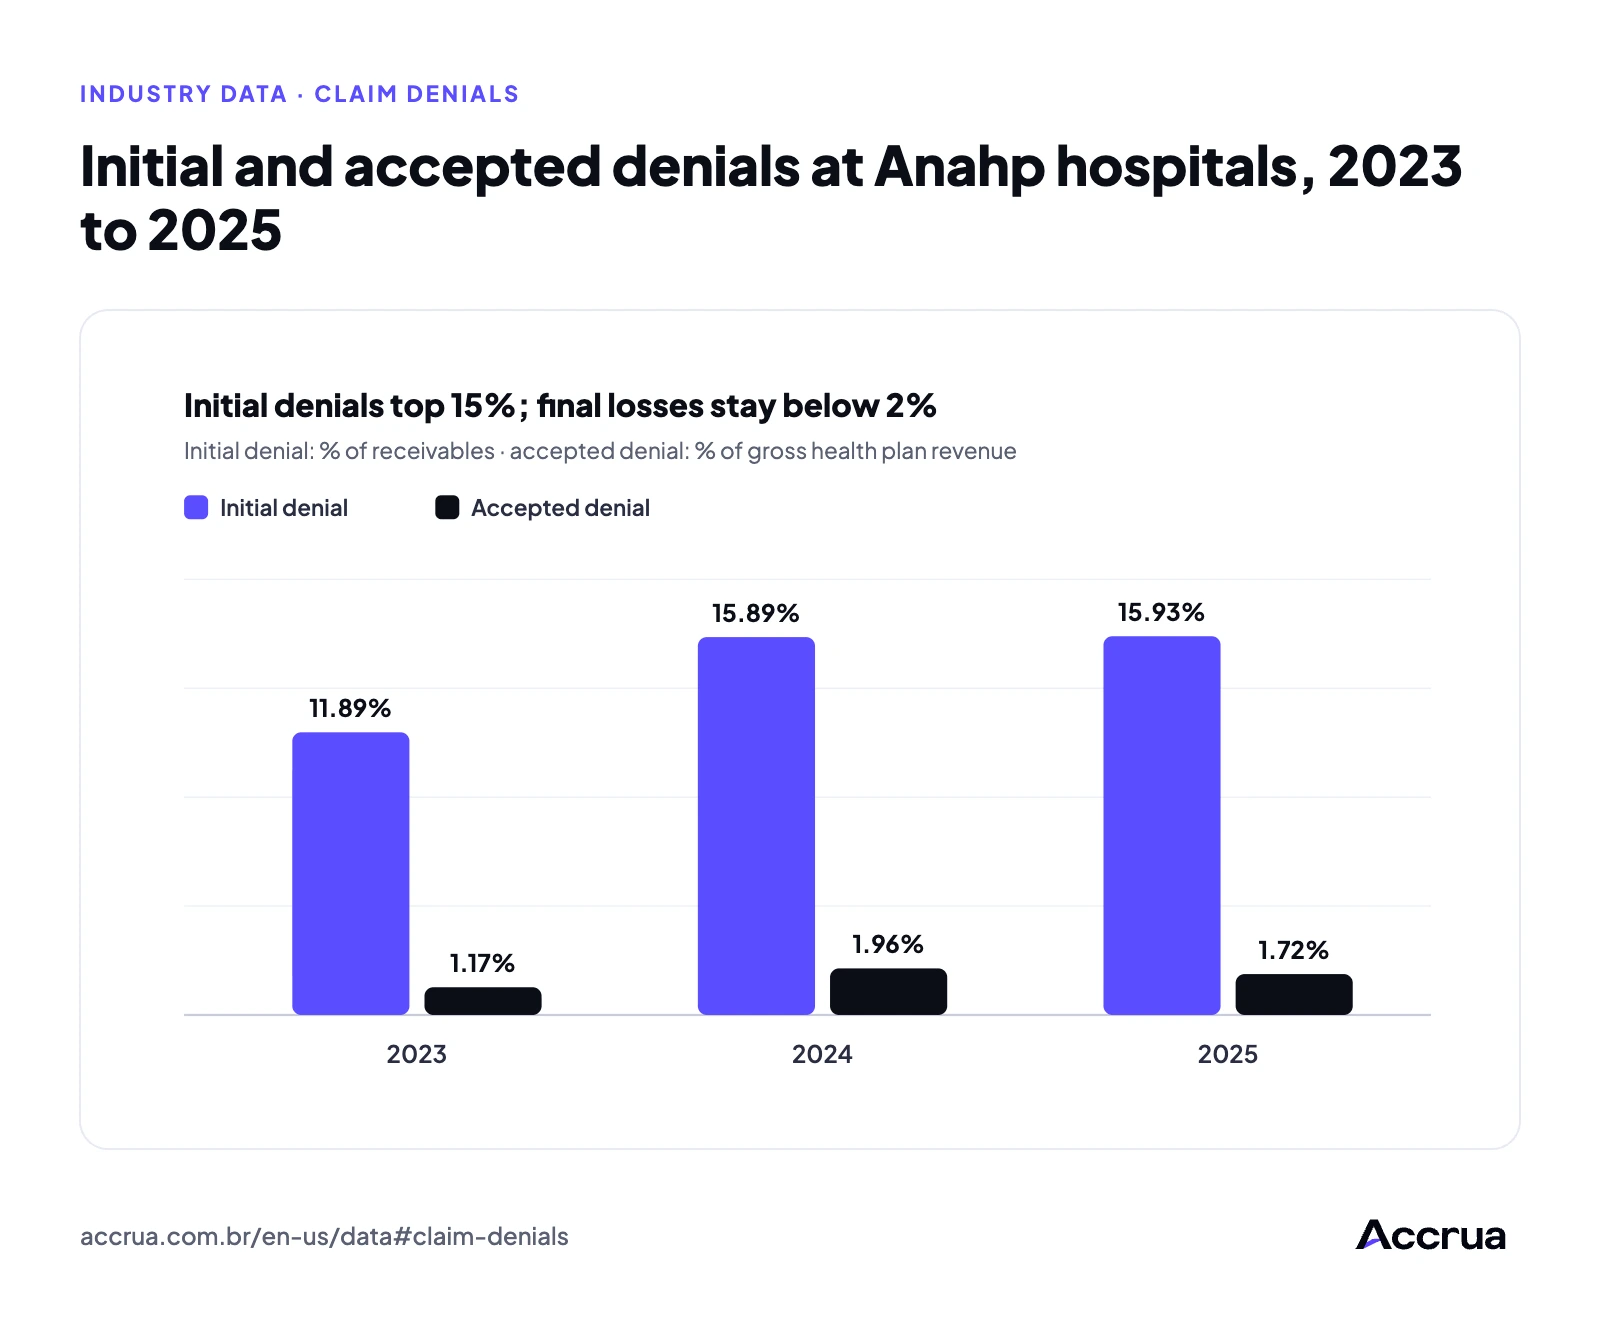
See in the guide: Hospital revenue forecasting: how to project cash by payerIndustry data · Claim denials Initial and accepted denials at Anahp hospitals, 2023 to 2025
Sources: Anahp Observatory 2025; Anahp Observatory Report, 9th ed. (Mar 2026). Anahp has measured initial denials since 2023.
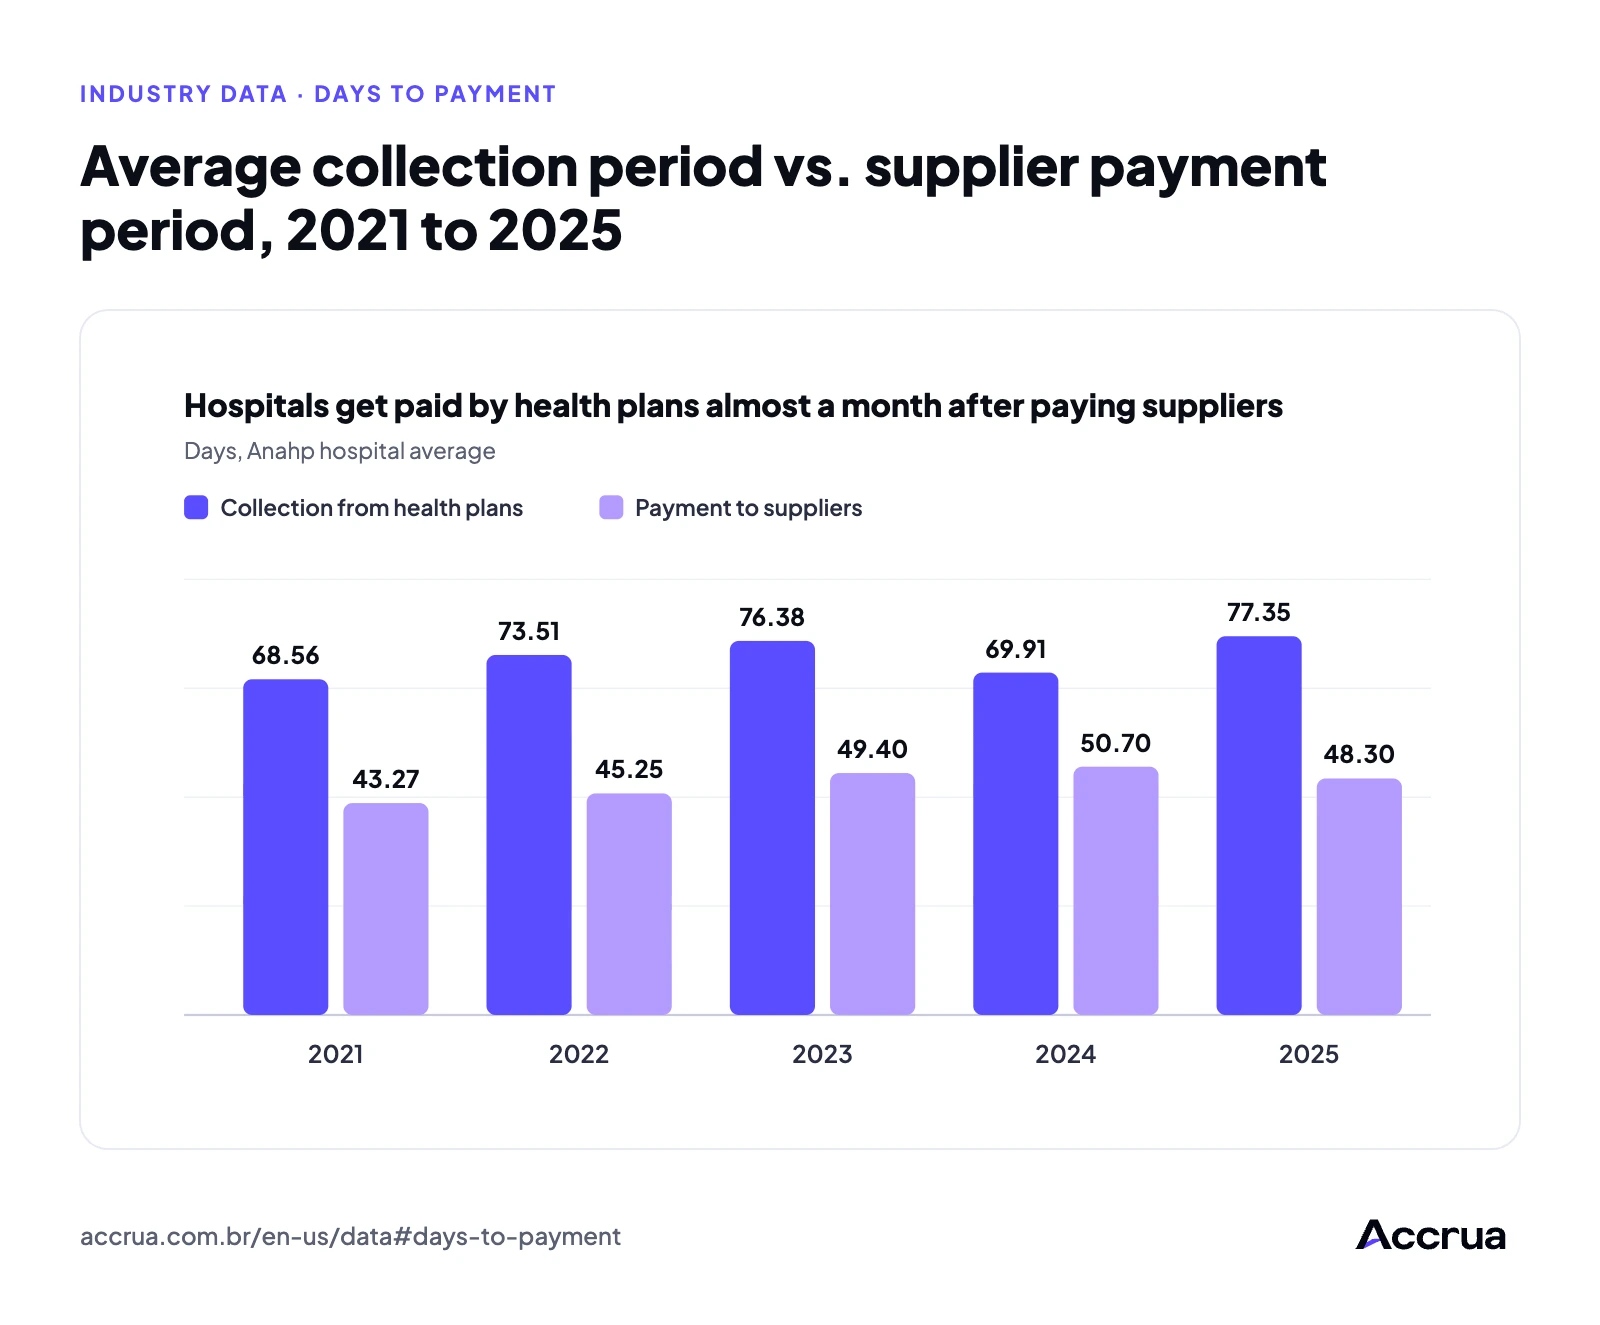
See in Industry dataIndustry data · Days to payment Average collection period vs. supplier payment period, 2021 to 2025
Sources: Anahp Observatory 2025; Anahp Observatory Report, 9th ed. (Mar 2026). Accounting period, from invoice issue to payment.
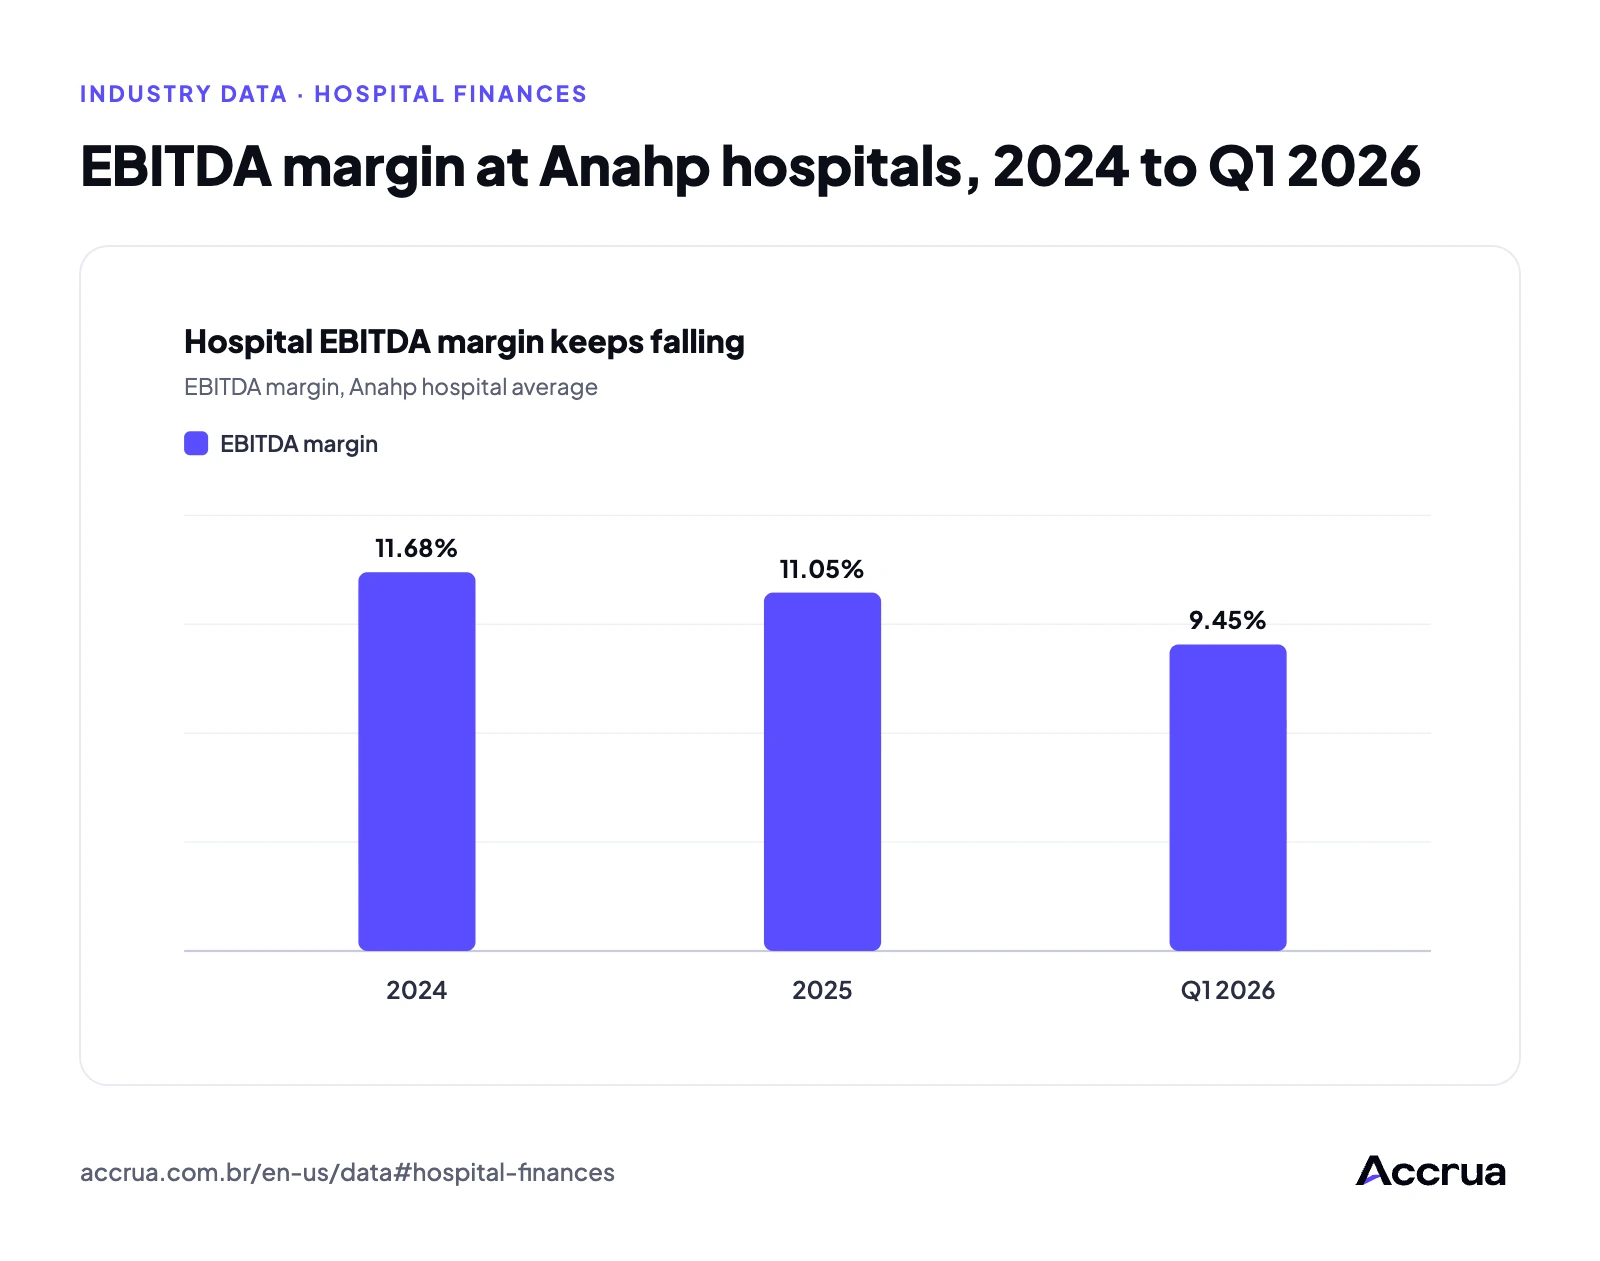
See in Industry dataIndustry data · Hospital finances EBITDA margin at Anahp hospitals, 2024 to Q1 2026
Source: Anahp Observatory Reports. Q1 2026 is a partial period.
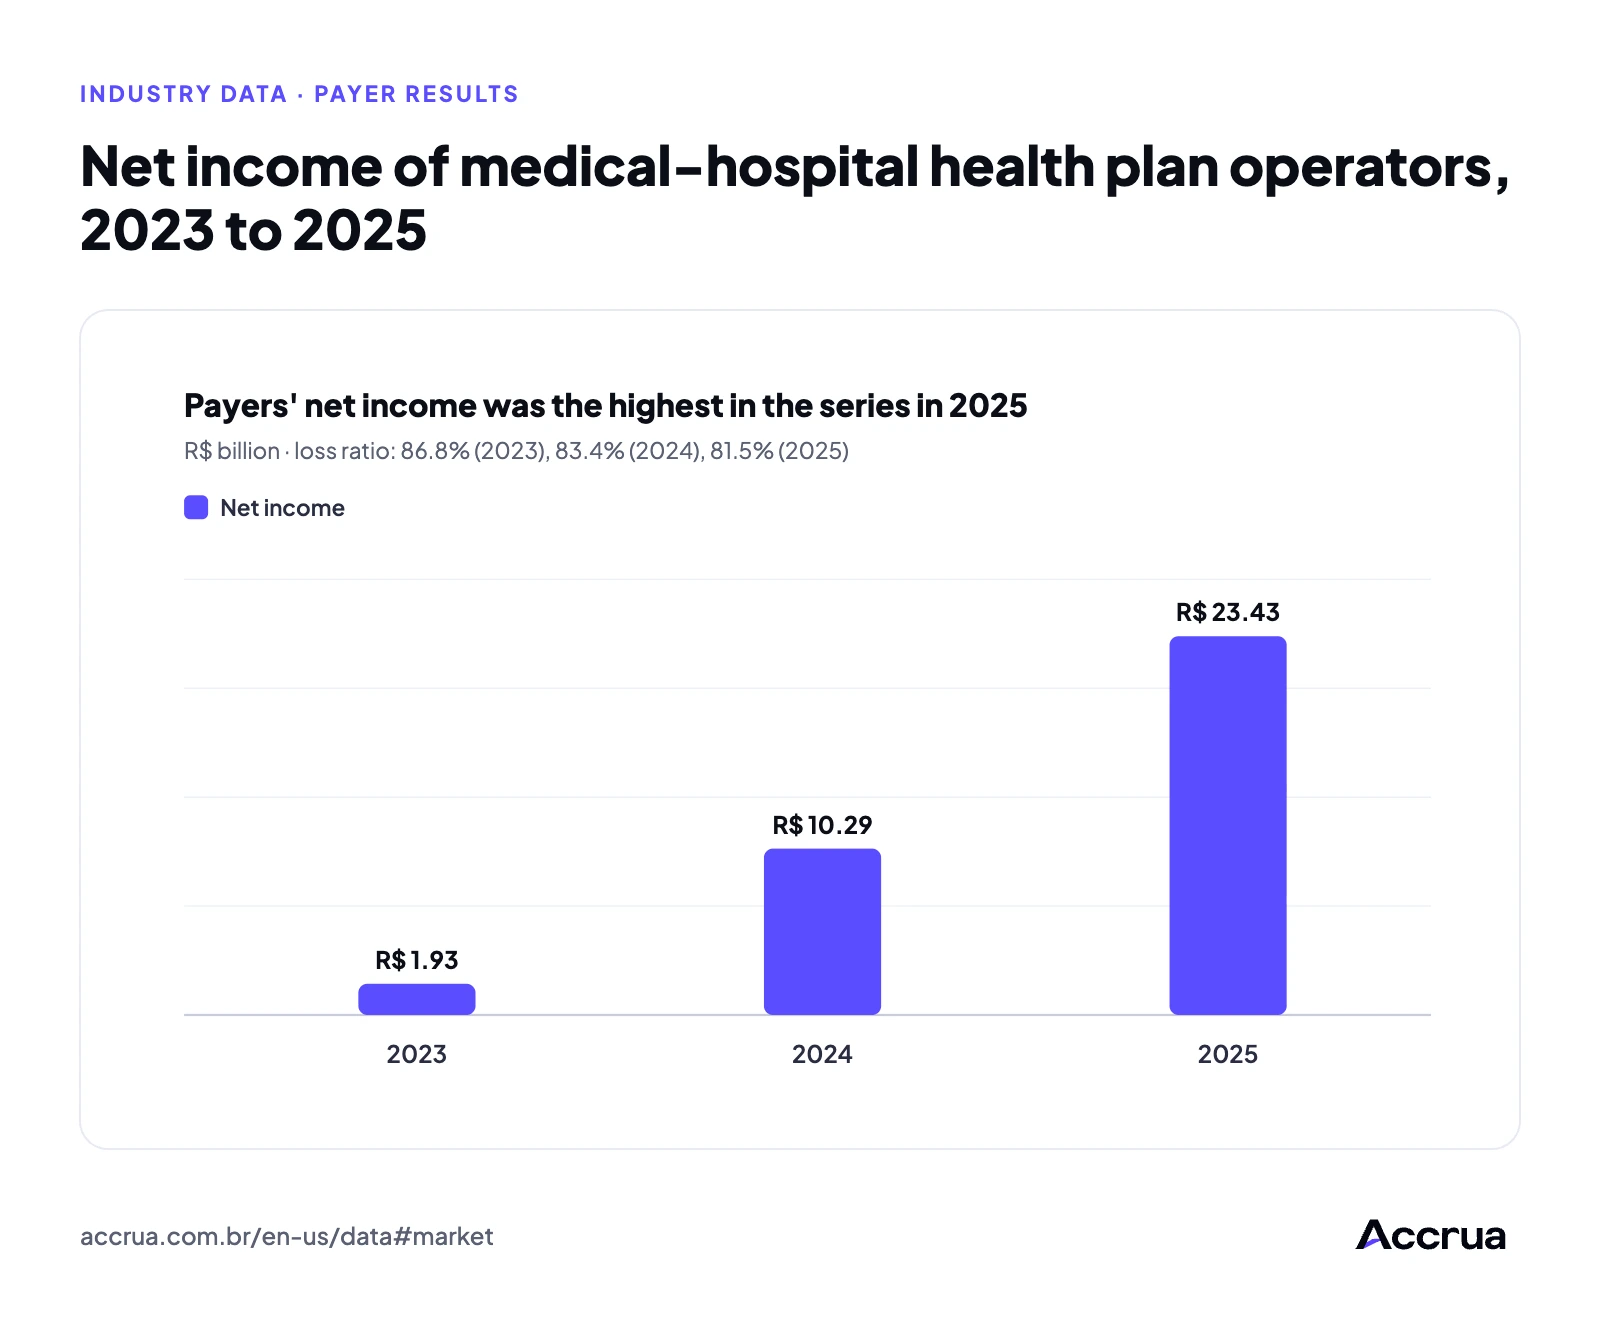
See in Industry dataIndustry data · Payer results Net income of medical-hospital health plan operators, 2023 to 2025
Source: ANS open data processed by Arquitetos da Saúde, Anahp Observatory Report, 9th ed. (Mar 2026). Excludes dental plan operators and benefit administrators.
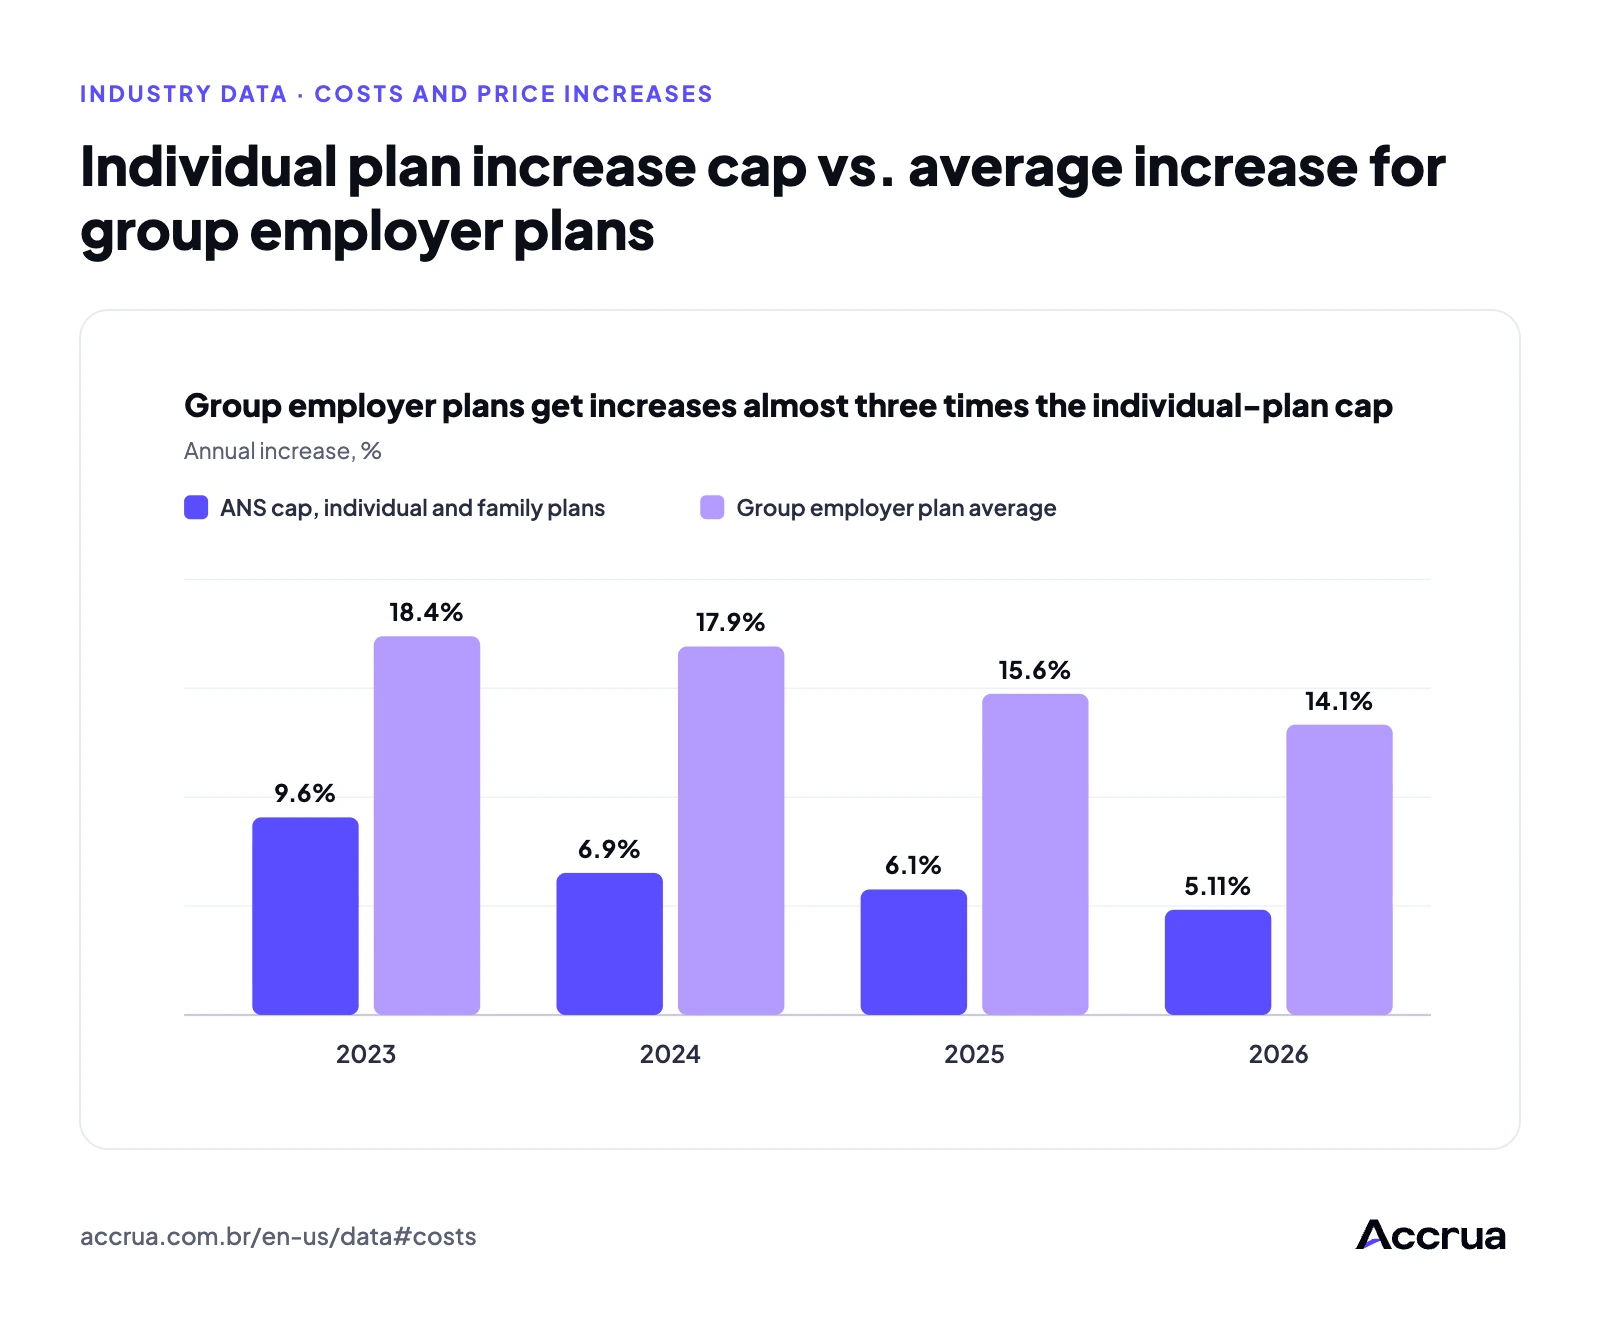
See in Industry dataIndustry data · Costs and price increases Individual plan increase cap vs. average increase for group employer plans
Source: ANS, via Anahp Observatory Report. 2026 group plans: 12 months to Feb 2026; 2026 cap: May 2026 to April 2027 cycle.
See in Industry data